Sets and Functions
Another Ruby conversion of a practical sheet from my course …
1. Sets
Ruby has a set library, built-in.
1.1. Construction
Constructing a set is straightforward:
irb(main):001> set1 = Set[1,2,3,1]
=> Set[1, 2, 3]
irb(main):002> all = Set[%w{a b c d e}]
=> Set[["a", "b", "c", "d", "e"]]
irb(main):003> set2 = Set[2/5r, 4, 10.6]
=> Set[(2/5), 4, 10.6]
Notice that:
-
duplicate elements are dropped, and
-
rational fractions can be defined in Ruby using the "r" suffix.
For cardinality, use size (or length):
irb(main):004> set2.size
=> 3
Membership is tested using member? (or include?):
irb(main):005> set1.member? 4
=> false
irb(main):006> set2.member? 4
=> true
Equality is tested using ==:
irb(main):007> set1 == Set[1,2,3]
=> true
irb(main):008> set1 == Set[1,2,3,3,2,4]
=> false
1.2. Subsets
Two methods check subset relationships: subset? and proper_subset?
irb(main):009> s = Set[2]
=> Set[2]
irb(main):010> s.proper_subset? set1
=> true
irb(main):011> s.proper_subset? set2
=> false
irb(main):012> set1.proper_subset? set1
=> false
irb(main):013> set1.subset? set1
=> true
irb(main):014> s.subset? set1
=> true
1.3. Set operations
intersection and union methods cover the main two operations.
difference can be used for set complement, against a known set.
irb(main):017> all = Set.new %w{a b c d e}
=> Set["a", "b", "c", "d", "e"]
irb(main):018> s1 = Set.new %w{a b c}
=> Set["a", "b", "c"]
irb(main):019> s2 = Set.new %w{c d}
=> Set["c", "d"]
irb(main):020> all.difference s1
=> Set["d", "e"]
irb(main):021> s1.intersection s2
=> Set["c"]
irb(main):022> s1.union s2
=> Set["a", "b", "c", "d"]
2. Functions
This section, in the original notes, is about plotting some functions using
numpy; this is covered quite well by numo.
2.1. Trigonometric functions
We start with a list of 100 points between 0 and 3pi, which we can create
using linspace from numo to define the range by the number of points:
irb(main):023> require 'numo/narray'
=> true
irb(main):025> theta = Numo::DFloat.linspace(0, 4*Math::PI, 100)
=>
Numo::DFloat#shape=[100]
[0, 0.0951998, 0.1904, 0.285599, 0.380799, 0.475999, 0.571199, 0.666398, ...]
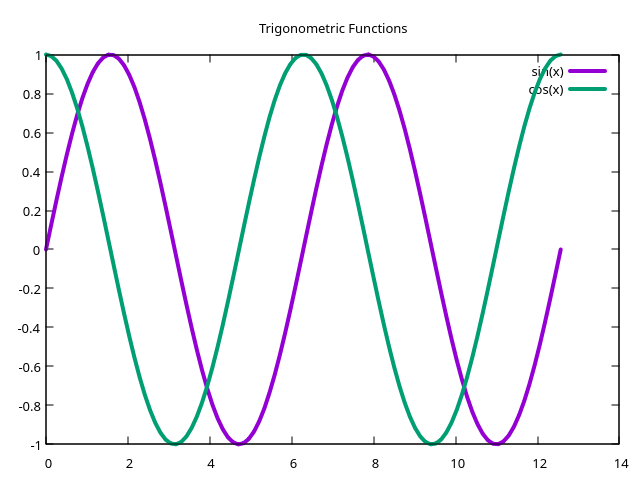
We continue with numo operations to create lists of sin/cos values from
these points:
irb(main):030> a = Numo::NMath.sin(theta)
=>
Numo::DFloat#shape=[100]
...
irb(main):031> b = Numo::NMath.cos(theta)
=>
Numo::DFloat#shape=[100]
...
The plotting part with gnuplot requires a little more setting up, and I do this in a separate file. The complete program is:
require 'numo/narray'
require 'gnuplot'

theta = Numo::DFloat.linspace(0, 4*Math::PI, 100)
a = Numo::NMath.sin(theta)
b = Numo::NMath.cos(theta)

Gnuplot.open do |gp|
  Gnuplot::Plot.new(gp) do |plot|
    plot.title "Trigonometric Functions"

    plot.data << Gnuplot::DataSet.new( [theta.to_a, a.to_a] ) do |ds|
      ds.title = "sin(x)"
      ds.with = "lines"
      ds.linewidth = 4
    end

    plot.data << Gnuplot::DataSet.new( [theta.to_a, b.to_a] ) do |ds|
      ds.title = "cos(x)"
      ds.with = "lines"
      ds.linewidth = 4
    end
  end
end
with the final display being:
2.2. Exponents and logarithms
numo provides exp, exp2 and exp10 taking the argument to powers of e, 2
and 10, respectively.
rb(main):035> x = Numo::DFloat.linspace(0, 10, 11)
=>
Numo::DFloat#shape=[11]
...
irb(main):036> x.to_a
=> [0.0, 1.0, 2.0, 3.0, 4.0, 5.0, 6.0, 7.0, 8.0, 9.0, 10.0]
irb(main):037> Numo::NMath.exp(x)
=>
Numo::DFloat#shape=[11]
[1, 2.71828, 7.38906, 20.0855, 54.5982, 148.413, 403.429, 1096.63, 2980.96, ...]
irb(main):038> Numo::NMath.exp2(x)
=>
Numo::DFloat#shape=[11]
[1, 2, 4, 8, 16, 32, 64, 128, 256, 512, 1024]
irb(main):039> Numo::NMath.exp10(x)
=>
Numo::DFloat#shape=[11]
[1, 10, 100, 1000, 10000, 100000, 1e+06, 1e+07, 1e+08, 1e+09, 1e+10]
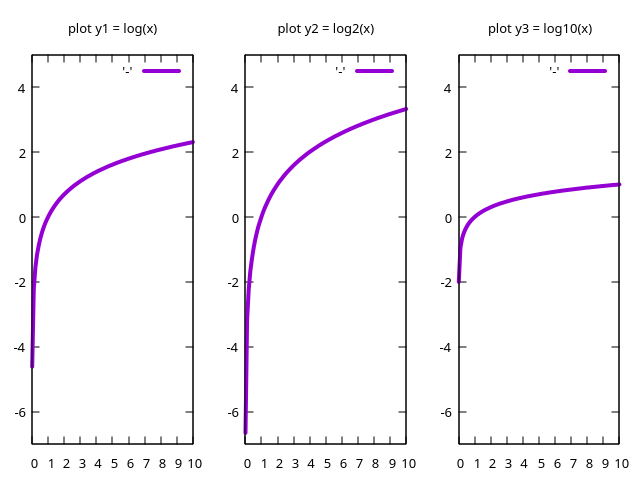
The following example graphs log, log2 and log10 from numo using
gnuplot’s multiplot layout:
require 'numo/narray'
require 'gnuplot'
require 'gnuplot/multiplot'

x = Numo::DFloat.linspace(0.01, 10)
a = Numo::NMath.log(x)
b = Numo::NMath.log2(x)
c = Numo::NMath.log10(x)

Gnuplot.open do |gp|
  Gnuplot::Multiplot.new(gp, layout: [1,3]) do |mp|
    Gnuplot::Plot.new(mp) do |plot|
      plot.title "plot y1 = log(x)"
      plot.yrange "[-7:5]"
      plot.data << Gnuplot::DataSet.new( [x.to_a, a.to_a] ) do |ds|
        ds.with = "lines"
        ds.linewidth = 4
      end
    end

    Gnuplot::Plot.new(mp) do |plot|
      plot.title "plot y2 = log2(x)"
      plot.yrange "[-7:5]"
      plot.data << Gnuplot::DataSet.new( [x.to_a, b.to_a] ) do |ds|
        ds.with = "lines"
        ds.linewidth = 4
      end
    end

    Gnuplot::Plot.new(mp) do |plot|
      plot.title "plot y3 = log10(x)"
      plot.yrange "[-7:5]"
      plot.data << Gnuplot::DataSet.new( [x.to_a, c.to_a] ) do |ds|
        ds.with = "lines"
        ds.linewidth = 4
      end
    end
  end
end