A wrapper around tklib’s plotchart library to work with LTk / nodgui.
The following summaries and examples should help in getting started with using plotchart through LTk / nodgui. Note that the library and options are complex, and not everything has been tested. However, all functions provided by ltk-plotchart are documented in the API documentation and linked to here under their corresponding chart type(s).
For more information on using plotchart see:
-
the plotchart documentation, which, although out of date in places, should be read in parallel with these notes;
-
the included examples, many of which translate the tcl examples;
-
the tklib/plotchart source.
Some options in plotchart are not currently available in ltk-plotchart.
1. Install and Test
The Tcl/Tk environment and the tklib extension library must be installed.
- on Linux/Mac OS X
-
The tk
wishprogram is often already installed, but otherwise both tk and tklib can be obtained using your usual package manager.
![]() For example, in Ubuntu:
For example, in Ubuntu:
> sudo apt install tk
> sudo apt install tklib
- on Windows 10 64 bit
-
-
Download and install Active Tcl (you will be asked to create an account before downloading it).
-
Download and unzip tklib-0.7.zip. Double-click "installer.tcl" to install the library.
-
To install ltk-plotchart, download the latest version and make the code available to the asdf system.
The API documentation is best built using baruch.
To test the internal functions (LTk only):
* (asdf:test-system :ltk-plotchart)
2. Basic Concepts
2.1. Using the library
2.1.1. With LTk
To use this library, you must require or asdf:load-system "ltk-plotchart".
LTk is included in "ltk-plotchart", so does not need separate attention.
The system provides the package "ltk-plotchart" with nickname "chart" - I use
the nickname in this documentation and examples.
The following examples can be run by copying them into the template:
(require 'asdf)            ;
(require 'ltk-plotchart)
(use-package :ltk)

(with-ltk ()
  ; PASTE THE EXAMPLE CODE HERE
  )
(require 'ltk-plotchart)
(use-package :ltk)
(with-ltk ()
; PASTE THE EXAMPLE CODE HERE
)| Depending on your lisp implementation - for CLISP, these must be strings. |
2.1.2. With Nodgui
To use this library, you must require or asdf:load-system
"ltk-plotchart/nodgui". "nodgui" is included in "ltk-plotchart/nodgui", so
does not need separate attention. The system provides the package
"nodgui-plotchart" with nickname "chart" - I use the nickname in this
documentation and examples.
The following examples can be run by copying them into the template:
(require 'asdf)            ;
(require 'ltk-plotchart/nodgui)
(use-package :nodgui)

(with-nodgui ()
  ; PASTE THE EXAMPLE CODE HERE
)| Depending on your lisp implementation - for CLISP, these must be strings. |
|
|
Ensure any floats are single floats - a fix is in nodgui repository to support double floats. |
2.2. Structure of library
Every chart is represented by a class, so for bar charts there is a bar-chart class.
An instance of the class can be constructed either directly, using keyword arguments
for the various parameters, or using a create-CHART function; this is similar to
the createCHART functions in the Tk documentation.
Names mostly echo those of the original library, to make using the original
documentation easier, although some have been changed to "bring together"
similar types, and try to make the calling code more readable. For example,
remove-from-legend has been renamed to legend-remove, and the various
circle, rectangle etc drawing methods are now renamed draw-circle,
draw-rectangle etc.
2.3. Passing values to options
Most Lisp types will be converted appropriately to the required tk format.
For some options tk expects a string, but from Lisp you can use a string-like
object. For example, the method chart:title-text sets the title to a given
string value with an optional position. The title should be a string, and will
be passed to tk as a string (in double-quotes, preserving case, etc).
The position value, as described in the tk documentation, must be one of "center", "left" or "right". In Lisp, we can pass in either a string, keyword or symbol: the value is converted to a lower-case string before passing it to tk.
So the following will set three titles, at different positions:
(chart:title-text chart "left-side" :left)
(chart:title-text chart "right-side" 'right)
(chart:title-text chart "centered" "CENTER")|
|
There is some error handling performed on the Lisp side, e.g. that the position value above is valid, or to check that an axis definition is correct, but in most cases values are converted and passed directly to Tk, which may report its own errors. |
3. Plotchart
The parent class of all charts.
Class: plotchart
Slot:
-
canvas- required parent canvas, within which to draw the plot
This class is private: you must pass the required canvas when creating
an instance of a chart but otherwise will not directly use the class.
![]() An example of creating a pie-chart, showing use of the required
An example of creating a pie-chart, showing use of the required
canvas keyword:
(let* ((c (make-instance 'canvas                          ;
                         :width 400 :height 400 :background :white))
       (pc (make-instance 'chart:pie-chart :canvas c))    ;
       )

  (pack c)
)
(pack c)| The canvas to hold the chart is created. | |
| The chart is given a reference to the canvas on construction. |
Functions (applicable to almost all charts):
![]() background
background (chart part colour-or-image &optional direction brightness)
![]() balloon
balloon (chart x y text direction)
![]() balloon-config
balloon-config
(chart &key font justify textcolour textcolor background outline margin
rimwidth arrowsize)
![]() draw-x-band
draw-x-band (chart ymin ymax)
![]() draw-y-band
draw-y-band (chart xmin xmax)
![]() legend
legend (chart series text &optional spacing)
![]() legend-config
legend-config (chart &key background border canvas font legend-type position spacing)
![]() legend-remove
legend-remove (chart series)
![]() plaintext
plaintext (chart x y text &optional direction)
![]() plaintext-config
plaintext-config (chart &key font justify textcolour textcolor)
![]() save-plot
save-plot (chart filename &key plotregion)
![]() subtitle
subtitle (chart title)
![]() title-text
title-text (chart title &optional position)
![]() v-subtext
v-subtext (chart text)
![]() v-text
v-text (chart text)
![]() x-config
x-config (chart &key format tick-length tick-lines minor-ticks label-offset scale)
![]() x-subtext
x-subtext (chart text)
![]() x-text
x-text (chart text)
![]() x-ticklines
x-ticklines (chart &optional colour dash)
![]() y-config
y-config (chart &key format tick-length tick-lines minor-ticks label-offset scale)
![]() y-subtext
y-subtext (chart text)
![]() y-text
y-text (chart text)
![]() y-ticklines
y-ticklines (chart &optional colour dash)
4. Bar Chart
Class: bar-chart
Constructor:
![]() create-bar-chart
create-bar-chart (canvas xlabels yaxis num-series &key xlabel-angle)
Functions:
![]() config
config (bar-chart &key show-values value-font value-colour value-format)
![]() plot
plot (bar-chart series data colour &optional direction brightness)
![]() Example ("bar-chart-example.lisp"):
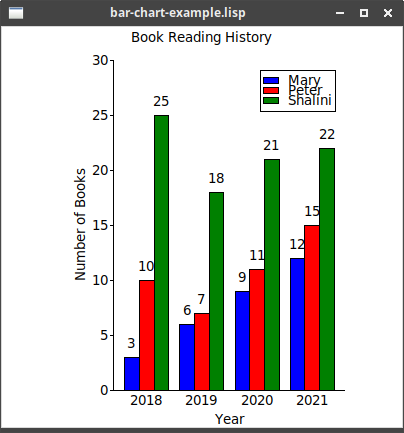
Example ("bar-chart-example.lisp"):
(wm-title *tk* "bar-chart-example.lisp")
(let* ((canvas (make-instance 'canvas :width 400 :height 400
:background :white))
(bar-chart (chart:create-bar-chart canvas ;
'(2018 2019 2020 2021)
'(0 30 5)
3)))
(grid canvas 0 0)
(chart:title-text bar-chart "Book Reading History") ;
(chart:x-text bar-chart "Year")
(chart:v-text bar-chart "Number of Books")
(chart:config bar-chart :show-values t) ;  (chart:plot bar-chart :person-1 '(3 6 9 12) :blue) ;
  (chart:plot bar-chart :person-2 '(10 7 11 15) :red)
(chart:plot bar-chart :person-3 '(25 18 21 22) :green)
(chart:legend bar-chart :person-1 "Mary") ;
(chart:plot bar-chart :person-2 '(10 7 11 15) :red)
(chart:plot bar-chart :person-3 '(25 18 21 22) :green)
(chart:legend bar-chart :person-1 "Mary") ;  (chart:legend bar-chart :person-2 "Peter")
(chart:legend bar-chart :person-3 "Shalini"))
(chart:legend bar-chart :person-2 "Peter")
(chart:legend bar-chart :person-3 "Shalini"))| Creates an instance of the bar chart, with years to label the x-axis and a min-max-step triple to define the y-axis values. It’s important to get the number of series right, for the spacing. | |
| These three lines set the title and axis-titles for the plot. | |
| Tells the bar chart to display the values above the bars. | |
| Add each set of values in turn - the "series" label is for reference only. | |
| We only get a legend if we attach a name to the "series" label. |
5. Box Plot
Class: box-plot
Constructor:
![]() create-box-plot
create-box-plot (canvas xdata ydata &key (orientation :horizontal)
Functions:
![]() data-config
data-config (box-plot series &key boxwidth whiskers whiskerwidth mediancolour medianwidth)
![]() plot
plot (box-plot series label values)
![]() Example ("box-plot-example.lisp"):
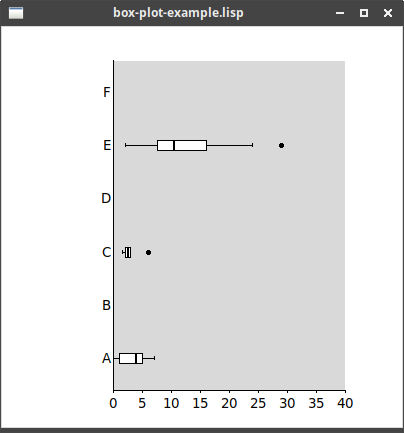
Example ("box-plot-example.lisp"):
(wm-title *tk* "box-plot-example.lisp")
(let* ((canvas (make-instance 'canvas :width 400 :height 400))
       (box-plot (chart:create-box-plot canvas '(0 40 5) '("A" "B" "C" "D" "E" "F"))))
  (grid canvas 0 0)

  (chart:plot box-plot 'data "A" '(0 1 2 5 7 1 4 5 0.6 5 5.5))                   ;
  (chart:plot box-plot 'data "C" '(2 2 3 6 1.5 3))
(chart:plot box-plot 'data "E" '(2 3 3 4 7 8 9 9 10 10 11 11 11 14 15 17 17 20 24 29)))| Notice how the box-plot function determines its form from a list of numbers. |
6. Gantt Chart
Class: gantt-chart
Constructor:
![]() create-gantt-chart
create-gantt-chart (canvas time-begin time-end &key num-items max-width bar-height ylabel-width)
Functions:
![]() colour
colour (gantt-chart keyword newcolour)
![]() connect
connect (gantt-chart from to)
![]() draw-vertical-line
draw-vertical-line (gantt-chart text time-point &key color colour)
![]() font
font (gantt-chart keyword newfont)
![]() horizontal-scrollbar
horizontal-scrollbar (gantt-chart hscroll)
![]() milestone
milestone (gantt-chart text time &optional colour)
![]() period
period (gantt-chart text time-begin time-end &optional colour)
![]() summary
summary (gantt-chart text &rest args)
![]() task
task (gantt-chart text time-begin time-end completed)
![]() vertical-scrollbar
vertical-scrollbar (time-chart vscroll)
![]() Example ("gantt-chart-example.lisp"):
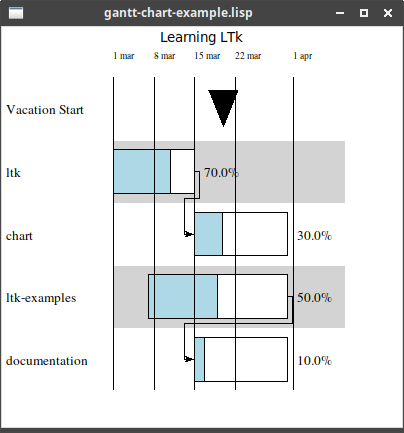
Example ("gantt-chart-example.lisp"):
(wm-title *tk* "gantt-chart-example.lisp")
(let* ((canvas (make-instance 'canvas :width 400 :height 400
                              :background :white))
       (gantt (chart:create-gantt-chart canvas "1 march 2021" "10 april 2021"   ;
                                        :num-items 5
                                        :ylabel-width 15))
       (zero (chart:milestone gantt "Vacation Start" "20 march 2021"))          ;
       (one (chart:task gantt "ltk" "1 march 2021" "15 march 2021" 70))         ;
       (two (chart:task gantt "chart" "15 march 2021" "31 march 2021" 30))
       (three (chart:task gantt "ltk-examples" "7 march 2021" "31 march 2021" 50))
       (four (chart:task gantt "documentation" "15 march 2021" "31 march 2021" 10)))
  (grid canvas 0 0)

  (chart:connect gantt one two)                                                 ;
  (chart:connect gantt three four)
  (chart:draw-vertical-line gantt "1 mar" "1 march 2021")                       ;
  (chart:draw-vertical-line gantt "8 mar" "8 march 2021")
  (chart:draw-vertical-line gantt "15 mar" "15 march 2021")
  (chart:draw-vertical-line gantt "22 mar" "22 march 2021")
  (chart:draw-vertical-line gantt "1 apr" "1 april 2021")

(chart:title-text gantt "Learning LTk"))| It is useful to give the chart more space than your tasks, to fit the information. | |
| Milestones are set for specific dates. | |
| Tasks are set with a start and end date, and a percentage completed. | |
| Connect tasks, to show a dependency. | |
| Lines are useful to highlight times. |
7. Histogram
Class: histogram
Constructor:
![]() create-histogram
create-histogram (canvas xaxis yaxis &key xlabels ylabels box axesbox)
Functions:
![]() data-config
data-config (histogram series &key colour color type symbol radius width filled fillcolour style)
![]() plot
plot (histogram series x-coord y-coord)
![]() plot-cumulative
plot-cumulative (histogram series x-coord y-coord)
![]() Example ("histogram-example.lisp"):
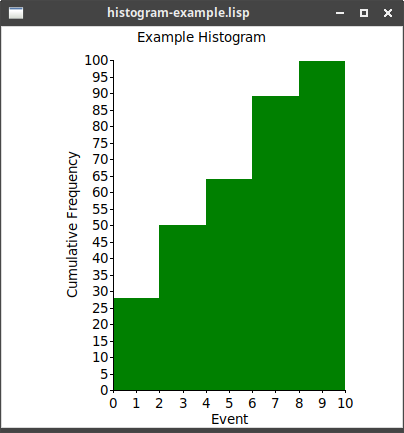
Example ("histogram-example.lisp"):
(wm-title *tk* "histogram-example.lisp")
(let* ((canvas (make-instance 'canvas :width 400 :height 400
                              :background :white))
       (histogram (chart:create-histogram canvas '(0 10 1) '(0 100 5))))
  (grid canvas 0 0)

  (chart:title-text histogram "Example Histogram")
  (chart:v-text histogram "Cumulative Frequency")
  (chart:x-text histogram "Event")

  (chart:data-config histogram "data"
                     :colour :green
                     :style :filled
                     :fillcolour :green)

  (loop for i from 2 to 10 by 2
    do (chart:plot-cumulative histogram "data" i (random 30))))   ;
Notice that i defines the right hand edge value of each bar. |
8. Horizontal Bar Chart
Class: horizontal-bar-chart
Constructor:
![]() create-horizontal-bar-chart
create-horizontal-bar-chart (canvas xaxis ylabels num-series &key xlabel-angle)
Functions:
![]() config
config (horizontal-bar-chart &key show-values value-font value-colour value-format)
![]() plot
plot (horizontal-bar-chart series data colour &optional direction brightness)
![]() Example ("horizontal-bar-chart-example.lisp"):
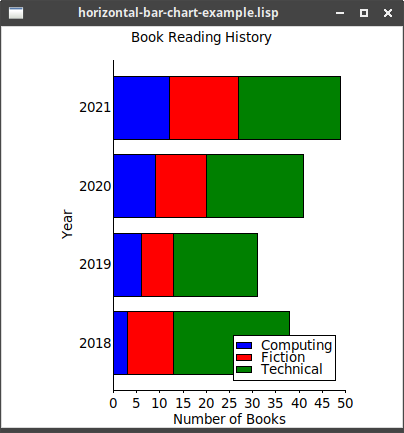
Example ("horizontal-bar-chart-example.lisp"):
(wm-title *tk* "horizontal-bar-chart-example.lisp")
(let* ((canvas (make-instance 'canvas :width 400 :height 400
                              :background :white))
       (bar-chart (chart:create-horizontal-bar-chart canvas
                                                     '(0 50 5)
                                                     '(2018 2019 2020 2021)
                                                     :stacked)))            ;
  (grid canvas 0 0)

  (chart:title-text bar-chart "Book Reading History")
  (chart:x-text bar-chart "Number of Books")
  (chart:v-text bar-chart "Year")

  (chart:plot bar-chart :type-1 '(3 6 9 12) :blue)
  (chart:plot bar-chart :type-2 '(10 7 11 15) :red)
  (chart:plot bar-chart :type-3 '(25 18 21 22) :green)

  (chart:legend-config bar-chart                                            ;
                       :position :bottom-right
                       :spacing 12)
  (chart:legend bar-chart :type-1 "Computing")
  (chart:legend bar-chart :type-2 "Fiction")
(chart:legend bar-chart :type-3 "Technical"))| This time, stack the bars. | |
| Adjust the position and spacing of items in the legend, for clarity. |
9. Isometric Plot
Class: isometric-plot
Constructor:
![]() create-isometric-plot
create-isometric-plot (canvas xaxis yaxis stepsize)
Functions:
![]() draw-circle
draw-circle (isometric-plot xc yc radius &optional colour)
![]() draw-filled-circle
draw-filled-circle (isometric-plot xc yc radius &optional colour)
![]() draw-filled-rectangle
draw-filled-rectangle (isometric-plot x1 y1 x2 y2 &optional colour)
![]() draw-rectangle
draw-rectangle (isometric-plot x1 y1 x2 y2 &optional colour)
![]() Example ("isometric-plot-example.lisp"):
Example ("isometric-plot-example.lisp"):
(wm-title *tk* "isometric-plot-example.lisp")
(let* ((canvas (make-instance 'canvas :width 400 :height 400
                              :background :white))
       (iso-plot (chart:create-isometric-plot canvas '(0.0 100.0) '(0.0 200.0) :noaxes)))
  (grid canvas 0 0)

  (chart:draw-rectangle iso-plot 10.0 10.0 50.0 50.0 :green)
  (chart:draw-filled-rectangle iso-plot 20.0 20.0 40.0 40.0 :red)
  (chart:draw-filled-circle iso-plot 70.0 70.0 40.0 :yellow)
  (chart:draw-circle iso-plot 70.0 70.0 42.0))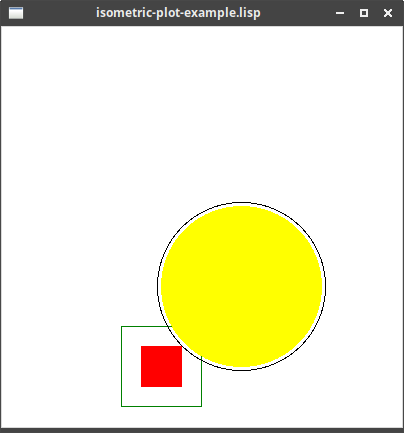
10. Pie Chart
Class: pie-chart
Constructor:
![]() create-pie-chart
create-pie-chart (canvas)
Functions:
![]() colours
colours (pie-chart colour-1 colour-2 …)
![]() explode
explode (pie-chart segment)
![]() plot
plot (pie-chart data)
![]() Example ("pie-chart-example.list"):
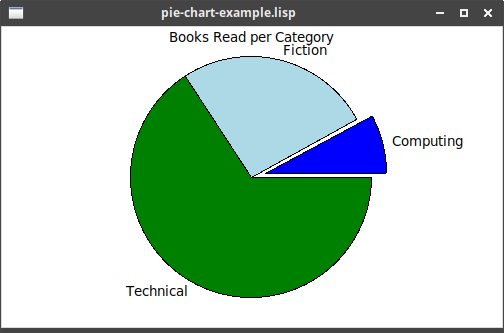
Example ("pie-chart-example.list"):
(wm-title *tk* "pie-chart-example.lisp")
(let* ((canvas (make-instance 'canvas :width 500 :height 300 :background :white))
       (pie-chart (chart:create-pie-chart canvas)))
  (grid canvas 0 0)

  (chart:title-text pie-chart "Books Read per Category")
  (chart:plot pie-chart '(("Computing" 3)                       ;
                          ("Fiction" 10)
                          ("Technical" 25)))
(chart:explode pie-chart 0)) ; | List of (label value) pairs defines the three slices | |
| Highlights the first slice |
11. Polar Plot
Class: polar-plot
Constructor:
![]() create-polar-plot
create-polar-plot (canvas radius-data &key xlabels ylabels box axesbox axesatzero isometric)
Functions:
![]() data-config
data-config (polar-plot series &key colour color type symbol radius width filled fillcolour)
![]() dot-config
dot-config (polar-plot series &key colour color scale radius scalebyvalue outline classes effect-3d)
![]() draw-dot
draw-dot (polar-plot series xcrd ycrd value)
![]() draw-label-dot
draw-label-dot (polar-plot x y text &optional orientation)
![]() draw-minmax
draw-minmax (polar-plot series xcoord ymin ymax)
![]() draw-region
draw-region (polar-plot series xlist ylist)
![]() plot
plot (polar-plot series x-coord y-coord)
![]() Example ("polar-plot-example.lisp"):
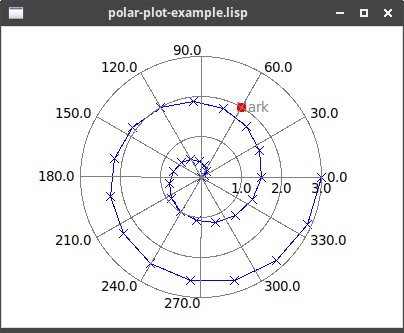
Example ("polar-plot-example.lisp"):
(wm-title *tk* "polar-plot-example.lisp")
(let* ((canvas (make-instance 'canvas :width 400 :height 300
                              :background :white))
       (polar-plot (chart:create-polar-plot canvas '(3.0 1.0))))
  (grid canvas 0 0)

  (chart:data-config polar-plot "line" :colour :blue  ;
                     :type :both :symbol :cross)

  (loop for r from 0 to 3.0 by 0.1
        for a from 0 by 24
        do (chart:plot polar-plot "line" r a))

(chart:draw-label-dot polar-plot 2 60 "Mark")) ; | The line drawn on a polar plot can be configured with colour and symbol type | |
| Draw a label/dot on the plot |
12. Radial Chart
Class: radial-chart
Constructor:
![]() create-radial-chart
create-radial-chart (canvas names scale &key (style "lines")
Function:
![]() plot
plot (radial-chart data colour &optional thickness)
![]() Example ("radial-chart-example.lisp"):
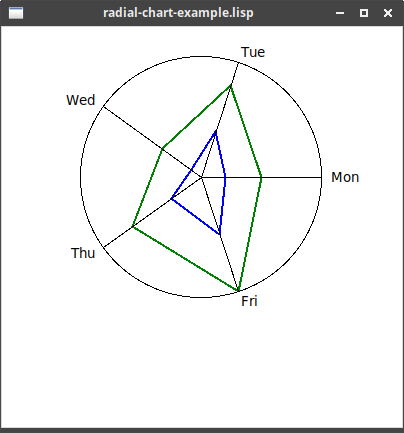
Example ("radial-chart-example.lisp"):
(wm-title *tk* "radial-chart-example.lisp")
(let* ((canvas (make-instance 'canvas :width 400 :height 400
                              :background :white))
       (radial-chart (chart:create-radial-chart canvas
                                                '("Mon" "Tue" "Wed" "Thu" "Fri") ;
                                                10.0)))
  (grid canvas 0 0)

  (chart:plot radial-chart '(5 8 4 7 10) :green 2)                               ;
(chart:plot radial-chart '(2 4 1 3 5) :blue 2))| Constructor gives labels for the spokes and scale is used for radius. | |
| Plot adds a line of data to the chart. |
13. Right Axis
Class: right-axis
Constructor:
![]() create-right-axis
create-right-axis (canvas yaxis)
Functions:
![]() data-config
data-config (right-axis series &key colour color type symbol radius width filled fillcolour)
![]() plot
plot (right-axis series x-coord y-coord)
![]() Example ("right-axis-example.lisp"):
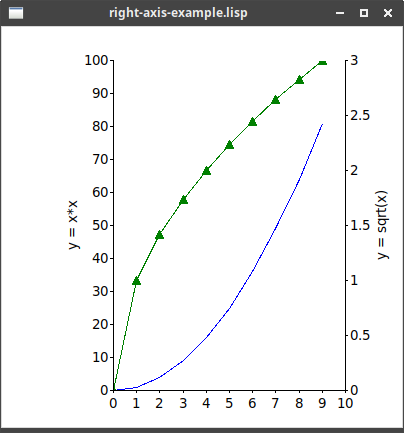
Example ("right-axis-example.lisp"):
(wm-title *tk* "right-axis-example.lisp")
(let* ((canvas (make-instance 'canvas :width 400 :height 400
                              :background :white))
       (xy-plot (chart:create-xy-plot canvas '(0 10 1) '(0 100 10)))
       (right-axis (chart:create-right-axis canvas '(0 3.0 0.5))))    ;
  (grid canvas 0 0)

  (chart:v-text xy-plot "y = x*x")
  (chart:v-text right-axis "y = sqrt(x)")                             ;

  (chart:data-config xy-plot "squares" :colour :blue)
  (chart:data-config right-axis "roots"                               ;
                     :colour :green
                     :type :both
                     :symbol :upfilled)

  (dotimes (x 10)
    (chart:plot xy-plot "squares" x (* x x))
(chart:plot right-axis "roots" x (sqrt x)))) ; | Right axis is added to an existing plot, but has its own y-axis range. | |
| Separate labels can be used for the main plot and the right axis. | |
| And values plotted against the right axis can have their own configuration. | |
Use the same plot function to add data to the right-axis plot. |
14. Spiral Pie
Class: spiral pie
Constructor:
![]() create-spiral-pie
create-spiral-pie (canvas)
Functions:
![]() colours
colours (spiral-pie colour-1 colour-2 …)
![]() plot
plot (spiral-pie data)
![]() Example ("spiral-pie-example.list"):
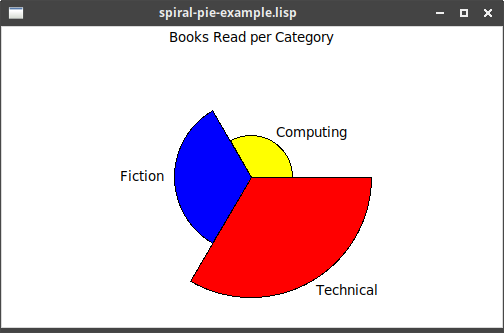
Example ("spiral-pie-example.list"):
(wm-title *tk* "spiral-pie-example.lisp")
(let* ((canvas (make-instance 'canvas :width 500 :height 300 :background :white))
       (spiral-pie (chart:create-spiral-pie canvas)))
  (grid canvas 0 0)

  (chart:colours spiral-pie :yellow :blue :red)                 ;

  (chart:title-text spiral-pie "Books Read per Category")
  (chart:plot spiral-pie '(("Computing" 3)
                           ("Fiction" 10)
("Technical" 25))))| Specify the colours to use, in slice order. |
15. Status Timeline
Class: status-timeline
Constructor:
![]() create-status-timeline
create-status-timeline (canvas xaxis ylabels &key box axesbox showxaxis)
Functions:
![]() draw-vertical-line
draw-vertical-line (chart text time-point &key color colour dash fill width)
![]() plot
plot (status-timeline series start stop &optional colour)
![]() Example is a conversion of a tklib example ("plotdemos18.list"):
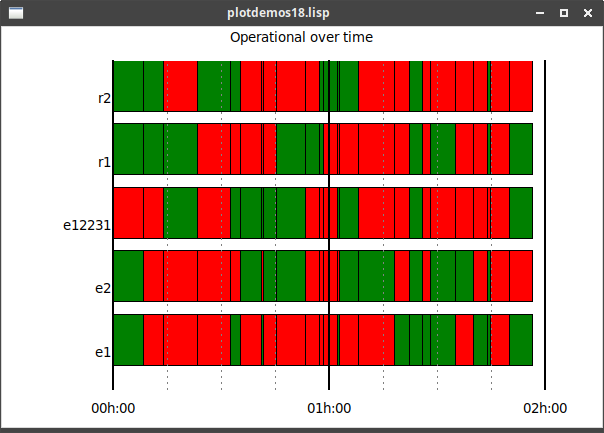
Example is a conversion of a tklib example ("plotdemos18.list"):
(wm-title *tk* "plotdemos18.lisp")
(let* ((devices '("e1" "e2" "e12231" "r1" "r2"))
       (canvas (make-instance 'canvas :width 600 :height 400
                              :background :white))
       (timeline (chart:create-status-timeline canvas '(0 7200 900) devices   ;
                                               :showxaxis nil)))
  (pack canvas :side :left :fill :both)

  ; add the randomised data
  (do* ((li 0 i)
        (i (random 10.0) (+ i (random 600.0))))
    ((>= i 7200))
    (dolist (item devices)
      (chart:plot timeline item li i (if (> (random 1.0) 0.5) :red :green)))) ;

  ; add labelled vertical lines
  (loop for x from 0 to 7200 by 900
        for text = (format nil "~2,'0Dh:~2,'0D"
                           (floor (/ x 3600))
                           (floor (mod x 60)))
        do (if (zerop (mod x 3600))
             (chart:draw-vertical-line timeline text x :fill :black :width 2) ;
             (chart:draw-vertical-line timeline "" x :fill :grey :dash "...")))

(chart:title-text timeline "Operational over time"))| Creates the chart with labelled y-axis, and no x-axis showing | |
| Adds a random 'patch' to the plot, in given series | |
| Draws a vertical line, using given style |
16. Table Chart
The table is used to represent information across several rows in columns.
Class: table-chart
Constructor:
![]() create-table-chart
create-table-chart (canvas columns &key widths)
Functions:
![]() cell-configure
cell-configure (table-chart &key background colour color font anchor justify)
![]() add-row
add-row (table-chart items)
![]() separator
separator (table-chart)
![]() Example of creating a simple table, with header ("table-example.lisp"):
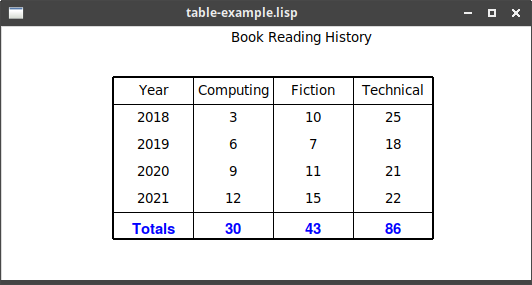
Example of creating a simple table, with header ("table-example.lisp"):
(wm-title *tk* "table-example.lisp")
(let* ((canvas (make-instance 'canvas :width 600 :height 400
                              :background :white))
       (table-chart (chart:create-table-chart
                      canvas
                      '("Year" "Computing" "Fiction" "Technical")
                      :widths 80)))                                 ;
  (grid canvas 0 0)

  (chart:title-text table-chart "Book Reading History")

  (chart:separator table-chart)                                     ;
  (chart:add-row table-chart '("2018" 3 10 25))                     ;
  (chart:add-row table-chart '("2019" 6 7 18))
  (chart:add-row table-chart '("2020" 9 11 21))
  (chart:add-row table-chart '("2021" 12 15 22))

  (chart:separator table-chart)
  (chart:cell-configure table-chart :colour :blue                   ;
                                    :font "Helvetica 11 bold")
(chart:add-row table-chart '("Totals" 30 43 86)))| The default width is too small, so specifies an equal pixel-width | |
| Separates header from rows | |
| Add each row of data to table | |
| Alter font for last row of table |
17. Ternary Diagram
Class: ternary-diagram
Constructor:
![]() create-ternary-diagram
create-ternary-diagram (canvas &key box axesbox fractions steps)
Functions:
![]() corner-text
corner-text (ternary-diagram xtext ytext ztext)
![]() data-config
data-config (ternary-diagram series &key colour color type symbol radius width filled fillcolour smooth)
![]() draw-filled-polygon
draw-filled-polygon (ternary-diagram series coords)
![]() draw-line
draw-line (ternary-diagram series coords)
![]() draw-ticklines
draw-ticklines (ternary-diagram &optional colour)
![]() plot
plot (ternary-diagram series xcrd ycrd zcrd text &optional direction)
![]() Example, translation of tcl "test_ternary.tcl":
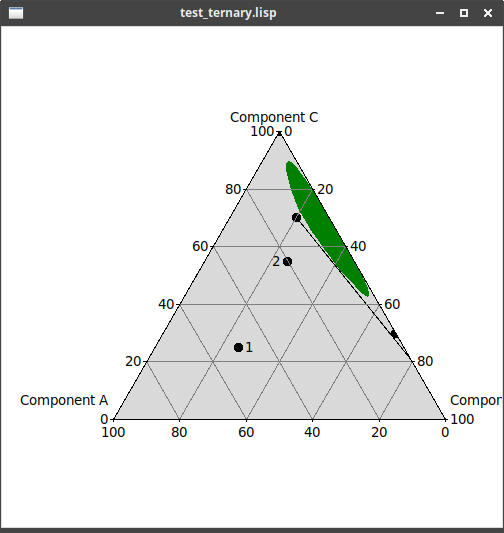
Example, translation of tcl "test_ternary.tcl":
(wm-title *tk* "test_ternary.lisp")
(let* ((canvas (make-instance 'canvas :width 500 :height 500))
       (ternary-diagram (chart:create-ternary-diagram canvas)))
  (pack canvas)

  (chart:corner-text ternary-diagram "Component A" "Component B" "Component C") ;
  (chart:plot ternary-diagram "data" 50.0 25.0 25.0 "1")                        ;
  (chart:plot ternary-diagram "data" 20.0 25.0 55.0 "2" :e)                     ;
  (chart:draw-line ternary-diagram "data" '((0.0 80.0 20.0) (10.0 20.0 70.0)))  ;

  (chart:data-config ternary-diagram :area :colour :green :smooth t)            ;
  (chart:draw-filled-polygon ternary-diagram :area
                             '((0.0 70.0 30.0) (10.0 20.0 70.0) (0.0 0.0 100.0)))
  (chart:plot ternary-diagram "area1" 0.0 70.0 30.0 "")
  (chart:plot ternary-diagram "area1" 10.0 20.0 70.0 "")
  (chart:plot ternary-diagram "area1" 0.0 0.0 100.0 "")

(chart:draw-ticklines ternary-diagram :grey)) ; 
| Labels the three corners of the diagram | |
| Places a labelled 'dot' at given coordinates | |
| Optional direction arranges label relative to the dot | |
| Lines defined as points, each point a triple of values | |
| Set some drawing properties | |
| Adding ticklines results in a triangular grid over the diagram |
18. 3D Bar Chart
Class: threed-bar-chart
Constructor:
![]() create-3d-bar-chart
create-3d-bar-chart (canvas yaxis &key (num-bars 1))
Functions:
![]() config
config (threed-bar-chart &key show-values value-font value-colour use-background use-ticklines label-font label-colour)
![]() plot
plot (threed-bar-chart label yvalue colour)
![]() Example ("threed-bar-chart-example.lisp"):
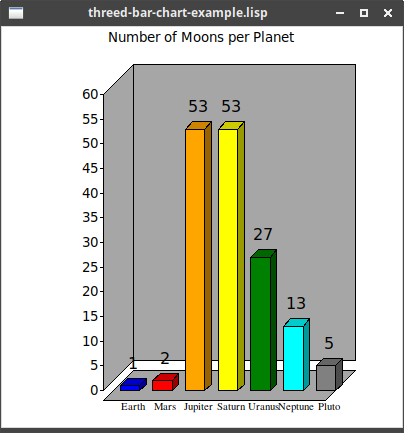
Example ("threed-bar-chart-example.lisp"):
(wm-title *tk* "threed-bar-chart-example.lisp")
(let* ((canvas (make-instance 'canvas :width 400 :height 400
                              :background :white))
       (bar-3d (chart:create-3d-bar-chart canvas '(0 60 5) :num-bars 7)))

  (grid canvas 0 0)

  (chart:title-text bar-3d "Number of Moons per Planet")

  (chart:config bar-3d :label-font "Times 8" :use-background t)   ;

  (chart:plot bar-3d "Earth" 1 :blue)
  (chart:plot bar-3d "Mars" 2 :red)
  (chart:plot bar-3d "Jupiter" 53 :orange)
  (chart:plot bar-3d "Saturn" 53 :yellow)
  (chart:plot bar-3d "Uranus" 27 :green)
  (chart:plot bar-3d "Neptune" 13 :cyan)
(chart:plot bar-3d "Pluto" 5 :grey))| Set some properties of the display. |
19. 3D Plot
Class: threed-plot
Constructor:
![]() create-3d-plot
create-3d-plot (canvas xaxis yaxis zaxis &key xlabels)
Functions:
![]() colour
colour (threed-plot fill border)
![]() gridsize
gridsize (threed-plot nxcells nycells)
![]() interpolate-data
interpolate-data (threed-plot data contours)
![]() plot-data
plot-data (threed-plot data)
![]() ribbon
ribbon (threed-plot yzpairs)
Draws a ribbon rather like shown in the 3D Ribbon Plot example.
![]() Example taken from "plotdemos1.lisp":
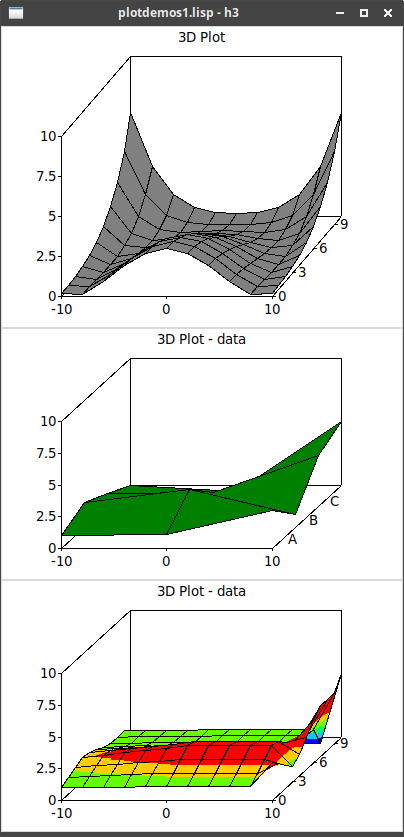
Example taken from "plotdemos1.lisp":
(labels ((square (n) (* n n))
         (cowboyhat (x y)
                    (let ((x1 (/ x 9.0))
                          (y1 (/ y 9.0)))
                      (* 3.0
                         (- 1.0 (+ (square x1) (square y1)))
                         (- 1.0 (+ (square x1) (square y1)))))))
  (let ((s (chart:create-3d-plot c '(0 10 3) '(-10 10 10) '(0 10 2.5))))  ;
    (chart:title-text s "3D Plot")
    (chart:plot-data s (mapcar #'(lambda (r)                              ;
                                   (mapcar #'(lambda (c)
                                               (cowboyhat r c))
                                           '(0 1 2 3 4 5 6 7 8 9 10)))
                               '(-10 -8 -6 -4 -2 0 2 4 6 8 10)))))

(let ((s (chart:create-3d-plot c2 '(0 10 3) '(-10 10 10) '(0 10 2.5)
                               :xlabels '(A B C))))
  (chart:title-text s "3D Plot - data")
  (chart:colour s :green :black)
  (chart:plot-data s '((1.0 2.0 1.0 0.0) (1.1 3.0 1.1 -0.5) (3.0 1.0 4.0 5.0))))

(let ((s (chart:create-3d-plot c3 '(0 10 3) '(-10 10 10) '(0 10 2.5))))
  (chart:title-text s "3D Plot - data")
  (chart:colour s :green :black)
  (chart:interpolate-data s                                               ;
                          '((1.0 2.0 1.0 0.0) (1.1 3.0 1.1 -0.5) (3.0 1.0 4.0 5.0))
'(0.0 0.5 1.0 1.5 2.0)))| Creates a 3D plot with given axes | |
| Uses a function to create an 11x11 array of values | |
| Interpolate colours the data, according to the given contours |
20. 3D Ribbon Plot
Class: threed-ribbon-plot
Constructor:
![]() create-3d-ribbon-plot
create-3d-ribbon-plot (canvas yaxis zaxis)
Function:
![]() plot
plot (threed-ribbon-plot yzpairs)
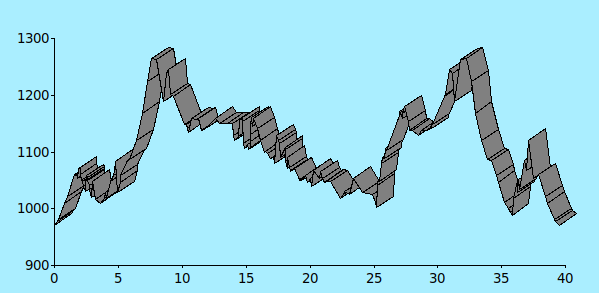
![]() Example taken from "plotdemos15.lisp" - not complete code:
Example taken from "plotdemos15.lisp" - not complete code:
(defparameter *yscale* '(0 40 5))          ;# Y axis is miles along route
(defparameter *zscale* '(900 1300 100))    ;# Z axis is altitude
; Each duple is distance along route (Y) and its altitude (Z)
(defparameter *YZ* '(
    ( 0    971) ( 0.2  977) ( 0.3  981) ( 0.8 1010) ( 1.0 1022) ( 1.6 1060)
  ; SNIP 32 LINES!
)

(let* ((c2 (make-instance 'canvas :width 800 :height 400
                          :background "#aaeeff"))
       (s2 (chart:create-3d-ribbon-plot c2 *yscale* *zscale*))) ;
  (configure c2 :border 0 :highlightthickness 0)
  (pack c2 :side :top :fill :both :expand t)
(chart:plot s2 *YZ*)) ; | Creates the ribbon-plot using axis definitions for y and z | |
| Draws the ribbon, using values for y-z pairs |
21. Time Chart
Class: time-chart
Constructor:
![]() create-time-chart
create-time-chart (canvas time-begin time-end &key num-items bar-height ylabel-width)
Functions:
![]() add-milestone
add-milestone (time-chart time-point &optional colour)
![]() add-period
add-period (time-chart time-begin time-end &optional colour)
![]() draw-vertical-line
draw-vertical-line (time-chart text time-point &key color colour
![]() horizontal-scrollbar
horizontal-scrollbar (time-chart hscroll)
![]() milestone
milestone (time-chart text time &optional colour)
![]() period
period (time-chart text time-begin time-end &optional colour)
![]() vertical-scrollbar
vertical-scrollbar (time-chart vscroll)
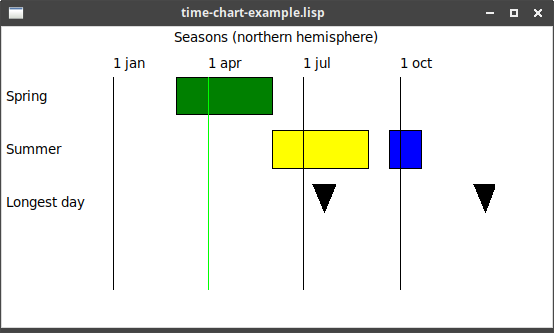
![]() Example taken from tcl "plotdemos7.tcl" ("time-chart-example.lisp"):
Example taken from tcl "plotdemos7.tcl" ("time-chart-example.lisp"):
(wm-title *tk* "time-chart-example.lisp")
(let* ((canvas (make-instance 'canvas :width 550 :height 300
                              :background :white))
       (time-chart (chart:create-time-chart canvas
                                            "1 january 2004" "31 december 2004" ;
                                            :num-items 4)))
  (grid canvas 0 0)

  (chart:title-text time-chart "Seasons (northern hemisphere)")

  (chart:period time-chart "Spring" "1 march 2004" "1 june 2004" :green)        ;
  (chart:period time-chart "Summer" "1 june 2004" "1 september 2004" :yellow)
  (chart:add-period time-chart "21 september 2004" "21 october 2004" :blue)     ;
  (chart:draw-vertical-line time-chart "1 jan" "1 january 2004")                ;
  (chart:draw-vertical-line time-chart "1 apr" "1 april 2004" :colour :lime)
  (chart:draw-vertical-line time-chart "1 jul" "1 july 2004")
  (chart:draw-vertical-line time-chart "1 oct" "1 october 2004")
  (chart:milestone time-chart "Longest day" "21 july 2004")                     ;
(chart:add-milestone time-chart "21 december 2004")) ; | Start/end times must be in appropriate format. | |
| A "period" is denoted as a filled rectangle, with given start/end times, and each period is on a new line with given label. | |
| Periods are added on to the previous period. | |
| Vertical lines are drawn using a time coordinate for the horizontal position. | |
| Milestones, like periods, are each put on a new line with given label. | |
| Adding a milestone adds it to the line of the previous milestone. |
22. TX Plot
Class: tx-plot
Constructor:
![]() create-tx-plot
create-tx-plot (canvas timeaxis xaxis &key box axesbox timeformat gmt axesatzero isometric)
Functions:
![]() data-config
data-config (xy-plot series &key colour color type symbol radius width filled fillcolour)
![]() draw-interval
draw-interval (tx-plot series time-coord xmin xmax &optional xcenter)
![]() plot
plot (tx-plot series time-coord x-coord)
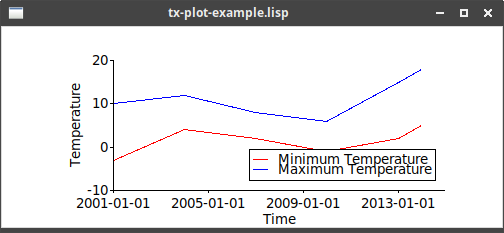
![]() Example ("tx-plot-example.lisp"):
Example ("tx-plot-example.lisp"):
(wm-title *tk* "tx-plot-example.lisp")
(let* ((canvas (make-instance 'canvas :width 500 :height 200 :background :white))
       (tx-plot (chart:create-tx-plot canvas
                                      '("2001-01-01" "2015-01-01" 1461)   ;
                                      '(-10.0 20.0 10.0))))
  (grid canvas 0 0)

  (chart:data-config tx-plot "min" :colour 'red)                          ;
  (chart:data-config tx-plot "max" :colour 'blue)

  (chart:x-text tx-plot "Time")
  (chart:v-text tx-plot "Temperature")

  (chart:legend-config tx-plot :position :bottom-right)
  (chart:legend tx-plot "min" "Minimum Temperature")
  (chart:legend tx-plot "max" "Maximum Temperature")

  (chart:plot tx-plot "min" "2001-01-01" -3.0)                            ;
  (chart:plot tx-plot "min" "2004-01-01" 4.0)
  (chart:plot tx-plot "min" "2007-01-01" 2.0)
  (chart:plot tx-plot "min" "2010-01-01" -1.0)
  (chart:plot tx-plot "min" "2013-01-01" 2.0)
  (chart:plot tx-plot "min" "2014-01-01" 5.0)

  (chart:plot tx-plot "max" "2001-01-01" 10.0)
  (chart:plot tx-plot "max" "2004-01-01" 12.0)
  (chart:plot tx-plot "max" "2007-01-01" 8.0)
  (chart:plot tx-plot "max" "2010-01-01" 6.0)
  (chart:plot tx-plot "max" "2013-01-01" 15.0)
(chart:plot tx-plot "max" "2014-01-01" 18.0))| For tx-plot, the (min max step) are two dates and a time period | |
| Uses the generic functions to set up properties of the chart | |
| And the plot command takes a date as its first coordinate. |
23. XY Plot
There are five related classes:
-
xy-plotis the parent chart type -
there are three variants, depending on whether the axis value uses log
-
strip-chartis a variant where the x-axis will grow if new points exceed the current bounds.
Class: xy-plot - x-logy-plot - logx-y-plot - logx-logy-plot - strip-chart
Constructors:
![]() create-xy-plot
create-xy-plot (canvas xaxis yaxis &key xlabels ylabels box axesbox timeformat gmt axesatzero isometric)
![]() create-logx-y-plot
create-logx-y-plot (canvas xaxis yaxis &key xlabels ylabels box axesbox timeformat gmt axesatzero isometric)
![]() create-x-logy-plot
create-x-logy-plot (canvas xaxis yaxis &key xlabels ylabels box axesbox timeformat gmt axesatzero isometric)
![]() create-logx-logy-plot
create-logx-logy-plot (canvas xaxis yaxis &key xlabels ylabels box axesbox timeformat gmt axesatzero isometric)
![]() create-strip-chart
create-strip-chart (canvas xaxis yaxis &key xlabels ylabels box axesbox timeformat gmt axesatzero isometric)
Functions:
![]() data-config
data-config (xy-plot series &key colour color type symbol radius width filled fillcolour)
![]() dot-config
dot-config (xy-plot series &key colour color scale radius scalebyvalue outline classes effect-3d)
![]() draw-box-and-whiskers
draw-box-and-whiskers (xy-plot series xcrd ycrd)
![]() draw-contour-fill
draw-contour-fill (xy-plot xcrds ycrds values &optional classes)
![]() draw-contour-lines
draw-contour-lines (xy-plot xcrds ycrds values &optional classes)
![]() draw-contour-lines-function-values
draw-contour-lines-function-values (xy-plot xvec yvec valuesmat &optional classes)
![]() draw-dot
draw-dot (xy-plot series xcrd ycrd value)
![]() draw-grid
draw-grid (xy-plot xcrds ycrds)
![]() draw-interval
draw-interval (xy-plot series xcoord ymin ymax &optional ycenter)
![]() draw-label-dot
draw-label-dot (xy-plot x y text &optional orientation)
![]() draw-minmax
draw-minmax (xy-plot series xcoord ymin ymax)
![]() draw-region
draw-region (xy-plot series xlist ylist)
![]() draw-trendline
draw-trendline (xy-plot series xcoord ycoord))
![]() draw-vector
draw-vector (xy-plot series xcrd ycrd ucmp vcmp)
![]() legend-isometric-lines
legend-isometric-lines (xy-plot values classes)
![]() legend-shades
legend-shades (xy-plot values classes)
![]() plot
plot (xy-plot series x-coord y-coord)
![]() plot-list
plot-list (xy-plot series xlist ylist &optional every)
![]() rchart
rchart (xy-plot series xcoord ycoord)
![]() vector-config
vector-config (xy-plot series &key colour color scale centred type)
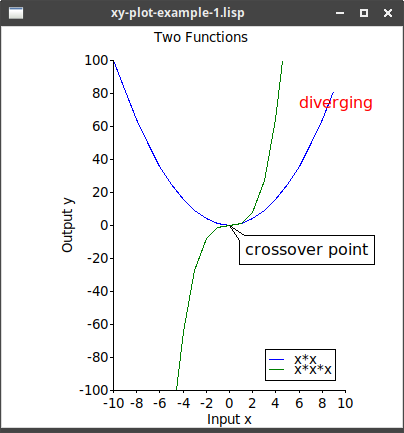
![]() An example plot:
An example plot:
(wm-title *tk* "xy-plot-example-1.lisp")
(let* ((canvas (make-instance 'canvas :width 400 :height 400 :background :white))
       (xy (chart:create-xy-plot canvas '(-10 10 2) '(-100 100 20))))   ;
  (grid canvas 0 0)

  (chart:title-text xy "Two Functions")                                 ;
  (chart:x-text xy "Input x")
  (chart:v-text xy "Output y")

  (chart:data-config xy "square" :colour 'blue)                         ;
  (chart:data-config xy "cube" :colour 'green)

  (chart:legend-config xy :position 'bottom-right)                      ;
  (chart:legend xy "square" "x*x")
  (chart:legend xy "cube" "x*x*x")

  (dotimes (n 20)
    (let ((i (- n 10)))
      (chart:plot xy "square" i (* i i))                                ;
      (chart:plot xy "cube" i (* i i i))))

  (chart:balloon xy 0 0 "crossover point" :north-west)                  ;
  (chart:plaintext-config xy :text-colour :red)                         ;
  (chart:plaintext xy 6 80 "diverging" :north-west)                     ;
  (chart:save-plot xy "xy-plot.ps"))                                    ;
| Create an xy-plot with x-axis [-10,10] and y-axis [-100,100] | |
| Use general functions to label the title and axes | |
data-config is used to set properties for the two lines |
|
| Set up the legend, to appropriately label each line | |
| Plot a given (x, y) item | |
| Add some text, pointing to location of the chart | |
| Change colour for plaintext | |
| … and display some text at given location | |
| Save the plot to a postscript file |
![]() Example of plotting using
Example of plotting using rchart - taken from "plotdemos6.lisp":
(let* ((rchart (make-toplevel *tk*))
       (canvas (make-instance 'canvas :master rchart
                              :background :white :width 400 :height 200))
       (s (chart:create-xy-plot canvas '(0 100.0 10.0) '(0.0 50.0 10.0))))
  (pack canvas :fill :both :side :top)

  (wm-title rchart "plotdemos6.lisp - rchart")
  (chart:title-text s "R-chart (arbitrary data)")

  (chart:data-config s "series1" :colour :green)
  (loop for x from 1.0 to 50.0 by 3.0
        for y = (+ 20.0 (random 3.0))
        do (chart:rchart s "series1" x y))

  ; now some data outside the expected range
  (chart:rchart s "series1" 50.0 41.0)
  (chart:rchart s "series1" 52.0 42.0)
  (chart:rchart s "series1" 54.0 39.0)

  ; and continue with the well-behaved series
  (loop for x from 57.0 to 100.0 by 3.0
        for y = (+ 20.0 (random 3.0))
        do (chart:rchart s "series1" x y)))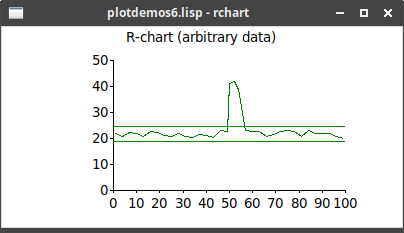
![]() Example of a contour plot - taken from "plotdemos5.lisp":
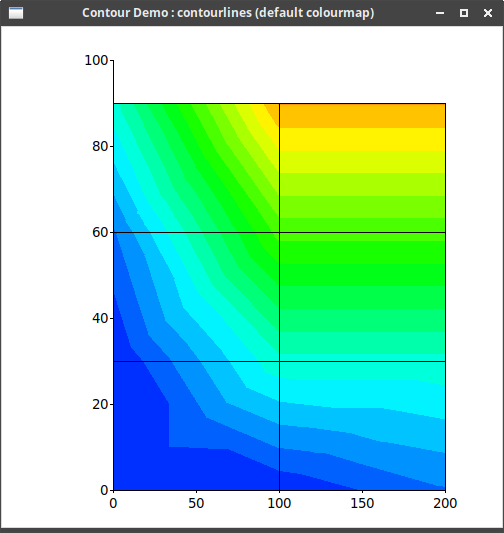
Example of a contour plot - taken from "plotdemos5.lisp":
(defparameter *x* '((0.0 100.0 200.0) (0.0 100.0 200.0) (0.0 100.0 200.0) (0.0 100.0 200.0)))
(defparameter *y* '((0.0   0.0   0.0) (30.0  30.0  30.0) (60.0  60.0  60.0) (90.0  90.0  90.0)))
(defparameter *f* '((0.0   1.0  10.0) ( 0.0  30.0  30.0) (10.0  60.0  60.0) (30.0  90.0  90.0)))
(defparameter *contours* '(0.0
                           5.2631578947
                           10.5263157895
                           15.7894736842
                           21.0526315789
                           26.3157894737
                           31.5789473684
                           36.8421052632
                           42.1052631579
                           47.3684210526
                           52.6315789474
                           57.8947368421
                           63.1578947368
                           68.4210526316
                           73.6842105263
                           78.9473684211
                           84.2105263158
                           89.4736842105
                           94.7368421053
                           100.0
                           105.263157895))
(defparameter *xlimits* '(0 200 50))
(defparameter *ylimits* '(0 100 20))
;
(with-ltk ()
(let* ((toplevel (make-toplevel *tk*))
       (c (make-instance 'canvas :master toplevel
                         :background :white :width 500 :height 500))
       (chart (chart:create-xy-plot c *xlimits* *ylimits*)))
  (wm-title toplevel "Contour Demo : contourlines (default colourmap)")
  (pack c :fill :both :side :top)

  (chart:draw-contour-fill chart *x* *y* *f* *contours*)    ;
  (chart:draw-grid chart *x* *y*))
)| *x* *y* *f* define the (x, y) point and its value. *contours* defines the boundaries between the colours. |
24. Windrose
Displays data in a circular fashion, at distances from the centre. Typically used in meteorology to display wind strength and direction.
|
|
Plotted data are not showing, from LTk or directly from Tk, so there may be an error in plotchart. |
Class: windrose
Constructor:
![]() create-windrose
create-windrose (canvas radius-data &key (num-sectors 16))
Function:
![]() plot
plot (windrose data colour)
![]() Example ("windrose-example.lisp"):
Example ("windrose-example.lisp"):
(wm-title *tk* "windrose-example.lisp")
(let* ((canvas (make-instance 'canvas :width 500 :height 300 :background :white))
       (windrose (chart:create-windrose canvas '(50 10) :num-sectors 5)))
 (grid canvas 0 0)

 (chart:plot windrose '(10 20 30 25 15) :green))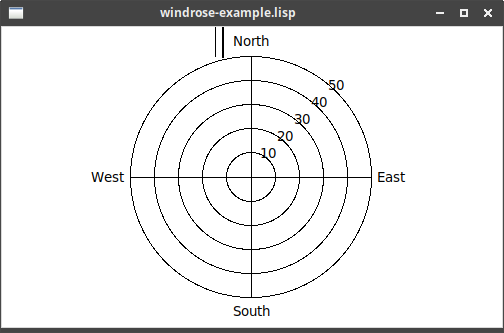
25. Miscellaneous
![]() colour-map
colour-map (colours)
![]() plot-config
plot-config (charttype component property value)
![]() plot-erase
plot-erase (plotchart)
![]() plot-pack
plot-pack (canvas direction &rest charts)